
The Halifax Thunderbirds are on the ascent. And we should have seen it coming sooner.
Thanks to three consecutive wins, Halifax now sits comfortably in the playoff picture at 5-3, just half a game behind San Diego and one full game behind Toronto and Albany. Could the Thunderbirds be the contenders that we aren’t talking about enough?
The season started beautifully for Halifax. The Thunderbirds won their first two games by a combined 13 goals and looked the part of a team destined for the top tier of the NLL. But in the ensuing four games, luck turned on Halifax, as the team lost three times by a total of five goals. They may be 5-3, but there is a very reasonable parallel reality in which the T-Birds are a perfect 8-0. So how do we make sense of them?
When we examine the Thunderbirds’ route to their current record, the first place to point our attention is toward their First Order Conversion Rate. In the LaxMetrics.com ecosystem, the First Order Conversion Rate is essentially the percentage of quality scoring chances that a team turns into goals. This season, the league-average conversion rate is roughly 27%. If a team’s conversion rate diverges significantly in one direction or the other, we can expect it to return to the average at some point between now and the end of the season. For example, if a team has a conversion rate of 33%, we can expect their rate to drop in the coming weeks until it averages out to approximately 27%. The same can be said for the inverse. If a team has a conversion rate over 27%, its scoring is unsustainable in the long term. If its rate is well below 27%, we can expect that team to score more in its future games.
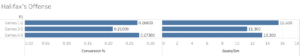
In the T-Birds’ case, their conversion rate has fluctuated wildly this year, overlaying their wins and losses. During the team’s 2-0 start, Halifax posted a conversion rate of 26.8%, which is almost exactly in line with the league average. More importantly, it was a sustainable mark. But in the subsequent three games, Halifax’s conversion rate plummeted to 21%, well below the league average. Now during the team’s three-game winning streak, the Thunderbirds have converted 27.3% of their chances, once again aligning with the league average.
The fluctuation of Halifax’s conversion rate is one reason that we shouldn’t be surprised by the squad’s recent surge. If we had stopped to investigate them when they were 2-3, we would have been able to conclude that the Thunderbirds were due for an uptick in their conversion rate, which correlates closely with an increased goal output. During their three-game winning streak, the Thunderbirds have averaged 13.3 goals per contest, exceeding their average of 11.3 goals per game during their three-game losing streak. All of this is to say that we shouldn’t be surprised by Halifax’s recent offensive surge.
On the other side of the ball, the Thunderbirds rank squarely in the middle of the league. Their Defensive Shooting Percentage of 17.5% ranks 8th and is roughly in line with the league average. Similar to the story offensively, the Thunderbirds struggled defensively during their three-game skid, surrendering a Defensive Shooting Percentage of 20.2%, which would rank 14th in the NLL. But during their three-game winning streak, the Thunderbirds have flipped the script, allowing a Defensive Shooting Percentage of only 16.9%, which would rank 6th in the NLL. The disparity defensively is shocking, but the turnaround is also something that we should have seen coming.
During the group’s 2-0 start, Halifax was tagged for a 13.2% Defensive Shooting Percentage, which was the best in the league through two games. Like the First Order Conversion Rate on offense, it is unlikely that a team will be able to sustain an exceptionally high or low Defensive Shooting Percentage over the course of the season. While there is more room for fluctuation than is the case with First Order Conversion Rate, Defensive Shooting Percentage is still subject to regression to the mean over the course of a full season.
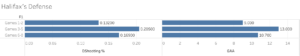
The league average Defensive Shooting Percentage is roughly 16.5%, meaning that both Halifax’s 13.2% mark during its 2-0 start and its 20.2% during its three-game losing streak were unsustainable in the long run. When the Thunderbirds were 2-3, we could have looked at their defensive splits and made the inference that their back end was likely to improve in the coming weeks.
One item that has been essential in Halifax’s defensive improvement is something that we likely could not have predicted based solely on the team’s first five games. The Thunderbirds gave up a ton of 1-v-1 shots during their losing streak, setting goaltender Warren Hill up to fail. During that stretch, opponents averaged 11 1-v-1 attempts per game, converting 42.5% of them into goals. In Halifax’s five wins, however, the back end has allowed an average of only 7.4 1-v-1 shots per game. While Hill hasn’t been much better in those situations during winning efforts, the fact that he’s faced more than 30% fewer 1-v-1 shots is massive.
Moving forward, what is reasonable for us to expect from Halifax? Are the Thunderbirds the group that started 2-3 or are they the tight-knit group in a a three-game winning streak?
Given that the team has lost three games—two to teams currently in playoff position—by a combined five goals, it feels foolish to discount them. If the last three games are any indicator of what’s to come for Halifax, we should expect a steady offensive output, buoyed by a highly sustainable 27% First Order Conversion Rate, and a defense that limits the number of excellent chances conceded to opponents.
It might be a little bit early to definitively say that the Thunderbirds are serious contenders for the NLL Title, but it is never too early to throw them in the general contender conversation.
If the Bandits, Rock, and Seals are the league’s top three teams, then Halifax isn’t far behind them.